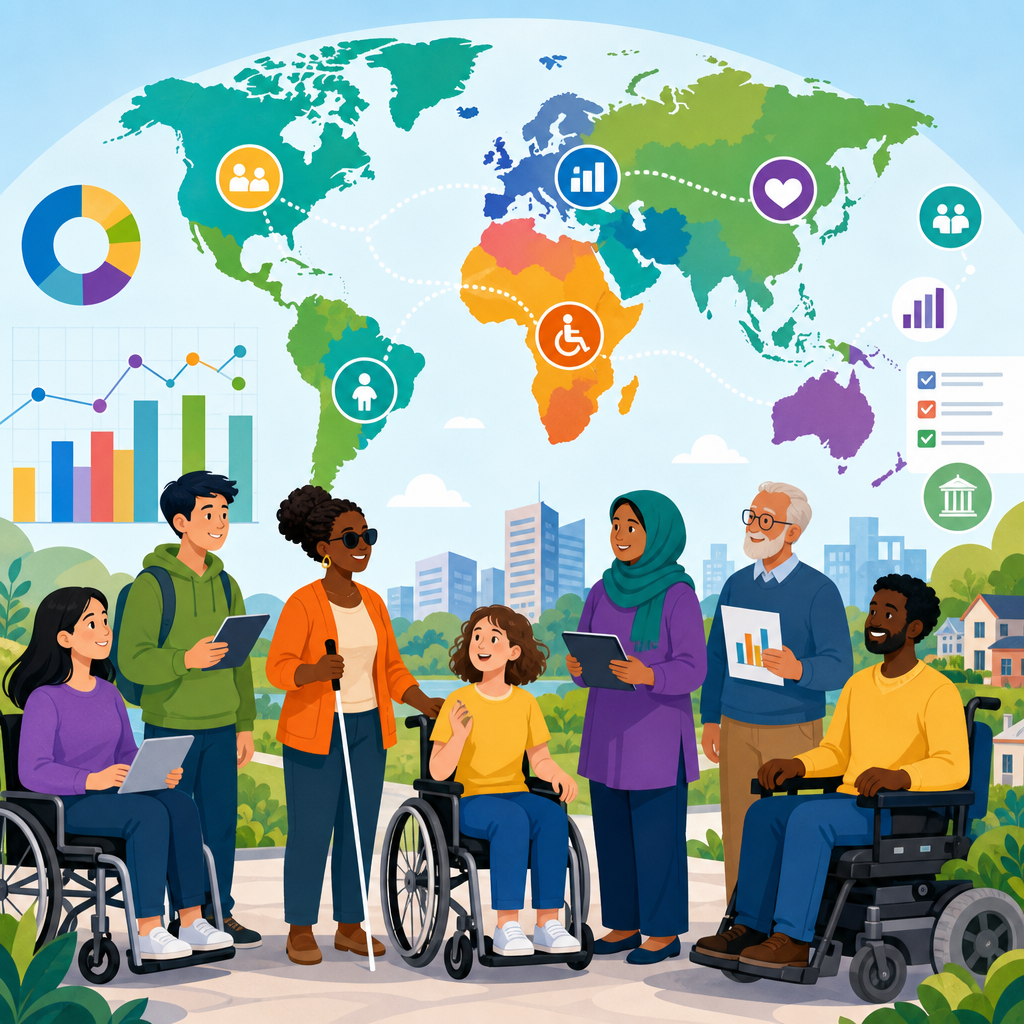
Worldwide trends in disability data and policy measurement are reshaping how governments, development banks, researchers, and disability organizations define accessibility, allocate resources, and judge whether inclusion efforts are working. Disability data refers to the structured collection of information about functional limitations, environmental barriers, service access, and social outcomes, while policy measurement means the methods used to track whether laws, programs, and budgets produce measurable improvements. In practice, these two fields are inseparable. If a country measures disability narrowly, it usually underestimates unmet need; if it measures policy weakly, it may report compliance on paper while people still face inaccessible transport, schools, health systems, websites, and workplaces. I have worked on accessibility benchmarking projects where a single wording change in a survey question altered prevalence estimates enough to affect budget projections, which shows why definitions and measurement choices matter so much.
The international shift over the past two decades has been away from a purely medical view of disability and toward a functional, rights-based, and environmental approach. That change is anchored by the Convention on the Rights of Persons with Disabilities, the World Health Organization’s International Classification of Functioning, Disability and Health, and the Washington Group question sets used in censuses and surveys across many regions. Together, these frameworks push institutions to ask better questions: Can a person see, hear, walk, remember, communicate, or care for themselves with or without aids? Do public systems remove barriers or create them? Are women, children, older adults, refugees, and Indigenous persons with disabilities represented in the data? These questions matter because disability inclusion is now tied to education outcomes, labor force participation, digital access, climate resilience, disaster planning, and sustainable development indicators.
This article serves as a hub for international innovations and strategies in accessibility by explaining the measurement systems behind them. It covers how disability prevalence is estimated, how national accessibility policies are compared, which indicators are most useful, where current data still fail, and which practical methods are improving evidence quality. For readers exploring the broader International Perspective topic, this page connects the policy side of accessibility with real implementation: universal design standards, accessible procurement, assistive technology access, inclusive urban planning, and digital compliance only become meaningful when they are measured consistently. The central lesson is straightforward: better disability data leads to better accessibility policy, and better policy measurement reveals whether inclusion is happening in everyday life.
How disability data standards are changing worldwide
The most important global trend is standardization around functioning rather than diagnosis alone. Traditional administrative systems often counted only people formally registered for benefits or those with medically certified impairments. That approach excluded many people, especially in low-resource settings where diagnosis is uneven, stigma is high, and registration systems are incomplete. The Washington Group Short Set improved comparability by focusing on six core domains of functioning: seeing, hearing, walking, cognition, self-care, and communication. UNICEF and the Washington Group later developed child functioning modules to address the long-recognized problem that children with disabilities were being undercounted in household surveys.
These tools do not solve every measurement problem, but they provide a practical baseline. National statistical offices can insert them into censuses, labor force surveys, health surveys, and education datasets, producing trend lines that were impossible when each ministry used its own disability definition. The World Bank, UN agencies, and regional development organizations increasingly encourage this harmonization because policy comparisons depend on common questions. A transport ministry cannot credibly claim progress on accessibility if disability prevalence, mobility barriers, and public transport usage are all measured with different thresholds across agencies.
Another major shift is disaggregation. Good disability statistics now separate data by sex, age, location, income, ethnicity where appropriate, migration status, and type of impairment or functional difficulty. This matters because accessibility barriers are not distributed evenly. For example, wheelchair users may report severe barriers in housing and transit, while deaf users may face stronger barriers in emergency alerts and health communication. Older adults with functional difficulties may be missing from employment discussions but highly visible in health and long-term care planning. International best practice now treats disability data as a cross-cutting lens rather than a standalone social welfare category.
What strong policy measurement looks like in accessibility
Strong policy measurement answers three questions directly: what was promised, what was implemented, and what changed for people. Many countries do reasonably well on the first question because laws and action plans are public. Fewer do well on the second and third. Accessibility policy measurement should therefore include inputs, outputs, outcomes, and lived-experience indicators. Inputs include budget allocations, staffing, technical guidance, and procurement rules. Outputs include ramp installations, captioned broadcasts, accessible buses procured, schools retrofitted, or government websites audited. Outcomes include higher transit use by disabled passengers, improved school attendance, more successful job applications, reduced healthcare delays, and fewer discrimination complaints.
In my experience reviewing accessibility scorecards, the most common error is relying on compliance counts alone. A city may report that 80 percent of new public buildings meet code, yet older buildings remain unusable, footpaths are obstructed, and elevator downtime is frequent. Measurement must capture usability, not just nominal compliance. The strongest systems combine regulatory audits with user testing, complaint data, and outcome surveys. Digital accessibility is a good example. Automated tools such as WAVE, axe, or Lighthouse can flag missing alt text and contrast issues, but they cannot fully assess keyboard navigation, screen reader logic, or cognitive accessibility. The policy metric should therefore pair technical testing with disabled user review.
Accessibility measurement also improves when timelines and enforcement mechanisms are explicit. Vague national strategies often fail because they list ambitions without deadlines, lead agencies, or sanctions. By contrast, measurable policy frameworks specify target dates, coverage percentages, reporting intervals, and public dashboards. When ministries publish annual accessibility progress updates tied to budget lines, civil society can monitor implementation rather than debate intentions.
Key indicators countries and institutions are using
The most useful disability policy indicators are specific enough to guide action yet broad enough to compare across countries. They usually cluster around legal protection, built environment, transport, digital systems, education, employment, health, social protection, and participation. Several international organizations also track whether persons with disabilities are consulted in policymaking, since participation is both a right and a quality-control mechanism. If representative organizations are absent from design and monitoring, accessibility investments often miss practical barriers.
The table below highlights common indicator categories and what they reveal in real policy settings.
| Indicator area | Example measure | Why it matters |
|---|---|---|
| Prevalence and demographics | Share of population reporting a lot of difficulty in core functioning domains | Sets baseline need and supports budget planning |
| Built environment | Percent of public buildings meeting access standards after independent audit | Shows whether legal standards reach daily public use |
| Transport | Share of bus and rail fleets with step-free boarding and audio-visual information | Measures practical mobility, not policy intent alone |
| Digital accessibility | Percent of government service pages conforming to WCAG criteria | Reflects access to essential online services |
| Education | Enrollment, attendance, and completion rates for learners with disabilities | Reveals inclusion beyond school placement |
| Employment | Labor force participation gap between disabled and non-disabled adults | Captures structural exclusion in the economy |
| Health access | Reported unmet healthcare need due to cost, transport, communication, or attitudes | Identifies barriers missed by insurance metrics |
| Participation | Formal consultation of disability organizations in lawmaking and monitoring | Improves legitimacy and implementation quality |
These indicators are strongest when used together. A country may score well on legal frameworks and still lag in employment or digital access. Another may improve school enrollment while failing to provide accessible learning materials or sign language support. Measurement has to follow the service journey from law to lived outcome.
Regional innovations in accessibility measurement and strategy
Different regions are advancing accessibility in different ways, and the data systems often reflect those priorities. In Europe, disability policy measurement is increasingly linked to equality law, public procurement, and digital standards. The European Accessibility Act and related national compliance systems have pushed organizations to measure website, e-commerce, ticketing, banking, and device accessibility in more operational terms. Several European states also combine household survey data with administrative data to examine employment gaps and independent living outcomes.
In North America, accessibility measurement tends to be more litigation-aware and standards-driven, especially in digital environments and public accommodations. Federal datasets, civil rights enforcement records, and agency accessibility plans create multiple evidence streams, though fragmentation remains a challenge. Canada’s Accessible Canada Act has strengthened planning and reporting expectations for federally regulated entities, offering a model where regulated bodies must publish accessibility plans, feedback processes, and progress reports.
Across Latin America, innovation often centers on social registries, inclusive education reforms, and local accessibility audits in major cities. Some governments have improved disability identification in household surveys, but differences between census data and benefit registries still create planning gaps. In parts of Africa and Asia, rapid progress is visible in integrating functioning questions into national surveys and in using mobile data collection to reach underserved areas. However, rural coverage, sign language inclusion, and disability-disaggregated administrative systems remain uneven. Small island states are also drawing attention to disability-inclusive disaster risk reduction, where evacuation accessibility, shelter design, and emergency communication are increasingly measurable components of resilience planning.
The strongest international strategies share one trait: they adapt global standards to local institutions instead of copying templates. A transport accessibility audit in Tokyo, Nairobi, São Paulo, or Stockholm will use different operational benchmarks, but all can still align around usability, independent access, and public accountability.
Persistent gaps: what the data still misses
Despite real progress, disability data and policy measurement still have serious blind spots. Psychosocial disabilities, chronic illnesses, neurodivergence, and fluctuating conditions are often underrepresented when surveys rely on narrow screening questions or poorly trained enumerators. Institutionalized populations, homeless populations, undocumented migrants, and people in conflict settings are also routinely missed. This means many national estimates remain conservative.
Administrative data poses another problem. Education systems may record whether a student has a recognized disability but not whether accommodations were provided, used, or effective. Employment services may count program participants without showing retention, wages, advancement, or workplace accessibility. Health systems often track diagnosis and treatment but not communication barriers, inaccessible equipment, or denial of informed consent. As a result, governments may know how many people entered a system while knowing far less about whether the system worked for them.
Comparability is also fragile. Two countries can report similar disability employment gaps while using different age bands, survey methods, and definitions of work. Even within one country, ministries may not share standards or interoperable identifiers. Privacy and ethics add complexity. Better linkage across datasets can illuminate exclusion patterns, but it must be governed carefully to avoid surveillance, misuse, or disclosure of sensitive information. Trust is essential, especially in communities that have experienced discrimination from state systems.
How to build better disability evidence for future policy
The next phase of international accessibility strategy should focus on integration, participation, and actionability. Integration means embedding disability variables in mainstream datasets rather than isolating disability in occasional specialist reports. Participation means designing indicators with disabled people and their representative organizations from the start. Actionability means every indicator should point to a concrete decision, such as where to retrofit stations, which procurement rules to tighten, or how to target captioning, interpretation, and assistive technology programs.
Several practical methods are proving effective. First, pair household survey data with service delivery data so policymakers can compare prevalence with actual program reach. Second, require accessibility impact reporting in public procurement, especially for transport, housing, education technology, and government software. Third, conduct periodic user-centered audits that include wheelchair users, blind users, deaf users, people with intellectual disabilities, and people with psychosocial disabilities. Fourth, publish open dashboards with plain-language notes on definitions, limitations, and update schedules. Fifth, train enumerators, inspectors, teachers, clinicians, and digital teams so measurement quality improves at the point of collection.
For this International Perspective hub, the wider lesson is clear: international innovations in accessibility succeed when data systems measure barriers, standards, budgets, and outcomes in one connected framework. If you are building policy, research, advocacy, or program design in this area, start by reviewing the indicators you already use, identify the missing lived-experience measures, and strengthen the evidence base before the next strategy cycle begins.
Worldwide trends in disability data and policy measurement show that accessibility improves fastest when countries move beyond symbolic commitments and invest in rigorous evidence. Functional data standards, disaggregated reporting, independent audits, user testing, and outcome tracking now form the backbone of credible accessibility policy. The countries and institutions making the strongest progress are not necessarily those with the most ambitious language; they are the ones that connect law, budgets, technical standards, and public reporting to everyday barriers people actually face.
As the hub for international innovations and strategies in accessibility, this article maps the measurement foundation beneath topics such as inclusive transport, digital accessibility, universal design, assistive technology, and disability-inclusive development planning. Use it as a starting point for deeper exploration across the International Perspective section, and evaluate every accessibility claim with the same practical question: what was measured, how was it measured, and did life become more accessible as a result? That discipline is what turns data into accountability and policy into inclusion.
Frequently Asked Questions
1. What does disability data include, and why is it becoming so important worldwide?
Disability data includes structured information about how people function in daily life, the barriers they encounter in physical and digital environments, their access to education, health care, transportation, employment, assistive technology, and the broader social and economic outcomes connected to inclusion. Increasingly, countries and international institutions are moving beyond narrow medical counts of disability and toward data systems that capture how impairment interacts with environmental and institutional barriers. This shift matters because a simple headcount rarely explains whether a person can attend school, use public services, participate in work, or access justice on equal terms.
Globally, this information has become essential because disability policy is no longer judged only by whether a law exists on paper. Governments, development banks, researchers, and disability organizations want evidence showing whether accessibility standards are being enforced, whether public spending is reaching intended populations, and whether inclusion programs are changing real outcomes. Better disability data helps decision-makers identify gaps between urban and rural areas, compare outcomes by gender and age, and understand how poverty, conflict, migration, and climate-related disruption affect disabled people differently. In practice, stronger data supports more accurate budgeting, better service design, and more credible accountability.
2. How are global trends changing the way disability is measured across countries?
One of the biggest worldwide trends is the move toward more standardized, function-based measurement. Rather than relying only on diagnosis lists or legal status categories, many countries now use survey questions that ask about difficulty seeing, hearing, walking, remembering, self-care, or communication. This allows national statistical systems to identify people who may face participation restrictions even if they have never received a formal medical diagnosis. It also improves comparability across countries, which is especially useful for international development tracking and cross-national research.
Another major trend is the integration of disability measurement into mainstream data systems instead of isolating it in occasional special studies. Disability-related questions are increasingly being added to censuses, household surveys, labor force surveys, education monitoring, health information systems, and administrative records. This creates a more complete picture of inclusion over time. At the same time, there is growing recognition that measurement must go beyond prevalence and examine lived outcomes: school completion, income security, digital access, civic participation, exposure to discrimination, and availability of reasonable accommodation. Together, these trends are making disability measurement more practical, more policy-relevant, and more aligned with rights-based frameworks.
3. What is policy measurement in the disability field, and how do institutions know whether policies are working?
Policy measurement refers to the tools and methods used to assess whether disability-related laws, programs, budgets, and institutional reforms are producing meaningful results. In the disability field, this can include tracking implementation of accessibility regulations, monitoring the availability of inclusive education supports, measuring wait times for assistive devices, reviewing budget allocations, and analyzing whether public services are usable by people with different functional needs. Good policy measurement does not stop at legal adoption. It asks whether people experience real change in daily life.
Institutions typically use a combination of indicators to judge progress. These may include input indicators such as funding levels and staffing, output indicators such as the number of accessible schools or retrofitted transit stations, and outcome indicators such as employment rates, school attendance, independent living, or reduced unmet care needs among disabled people. Increasingly, institutions also look at process indicators, including consultation with organizations of persons with disabilities and the quality of grievance mechanisms. The strongest measurement systems combine quantitative data with qualitative evidence, because numbers may show trends while lived experience reveals whether policy implementation is respectful, equitable, and effective.
4. Why do many experts say disability data must be disaggregated and intersectional?
Experts emphasize disaggregated and intersectional disability data because disabled people are not a single uniform group. Outcomes can vary dramatically depending on gender, age, location, income, ethnicity, type of functional difficulty, migration status, and exposure to conflict or disaster. If data is presented only as one national average, it can hide serious inequalities. For example, a country may report overall improvements in school access for disabled children while rural girls with disabilities remain excluded, or urban infrastructure may improve while digital public services remain inaccessible to people with communication or cognitive barriers.
Intersectional analysis helps policymakers understand where exclusion is concentrated and which policy responses are most urgent. It supports smarter targeting of resources, better service design, and more equitable monitoring. It also strengthens accountability by showing whether progress is being shared broadly or whether some communities are consistently left behind. From an international policy perspective, this matters because many development goals depend on identifying who is not benefiting from growth, reform, or public investment. Without disaggregated disability data, inclusion efforts can look successful in reports while failing in practice for the people facing the greatest barriers.
5. What are the biggest challenges in improving disability data and policy measurement worldwide?
Several persistent challenges continue to affect progress. One is inconsistency in definitions and methods across countries and institutions. When disability is measured differently in censuses, surveys, and administrative systems, results become difficult to compare or use for planning. Another challenge is underreporting, which can happen because of stigma, lack of awareness, fear of losing benefits, or survey designs that fail to capture less visible forms of disability. Administrative data systems may also be incomplete if they only include people already connected to formal services, leaving out those who are excluded from institutions altogether.
There are also major capacity and governance issues. Many countries need stronger statistical infrastructure, better interviewer training, improved accessibility in data collection tools, and closer coordination between ministries, national statistical offices, and disability organizations. Just as important, data must be collected ethically and used responsibly. Privacy, informed participation, accessible formats, and meaningful involvement of persons with disabilities are central to trustworthy measurement. The long-term trend is positive: more institutions now recognize that high-quality disability data is not a technical side issue but a foundation for inclusive policy. Still, real progress depends on sustained investment, consistent standards, and a clear commitment to measuring outcomes that reflect dignity, autonomy, and equal participation.